Resources
While the Dashboard gives you a snapshot of right now, the Resources page gives you context. A Live / History switch at the top of the page lets you choose between two very different views:
- Live — six subsystem cards in a responsive 2-column grid, each tracking the last 60 seconds of activity, updated every second.
- History — an opt-in, persisted log of CPU, load, and memory going back hours, days, or weeks.
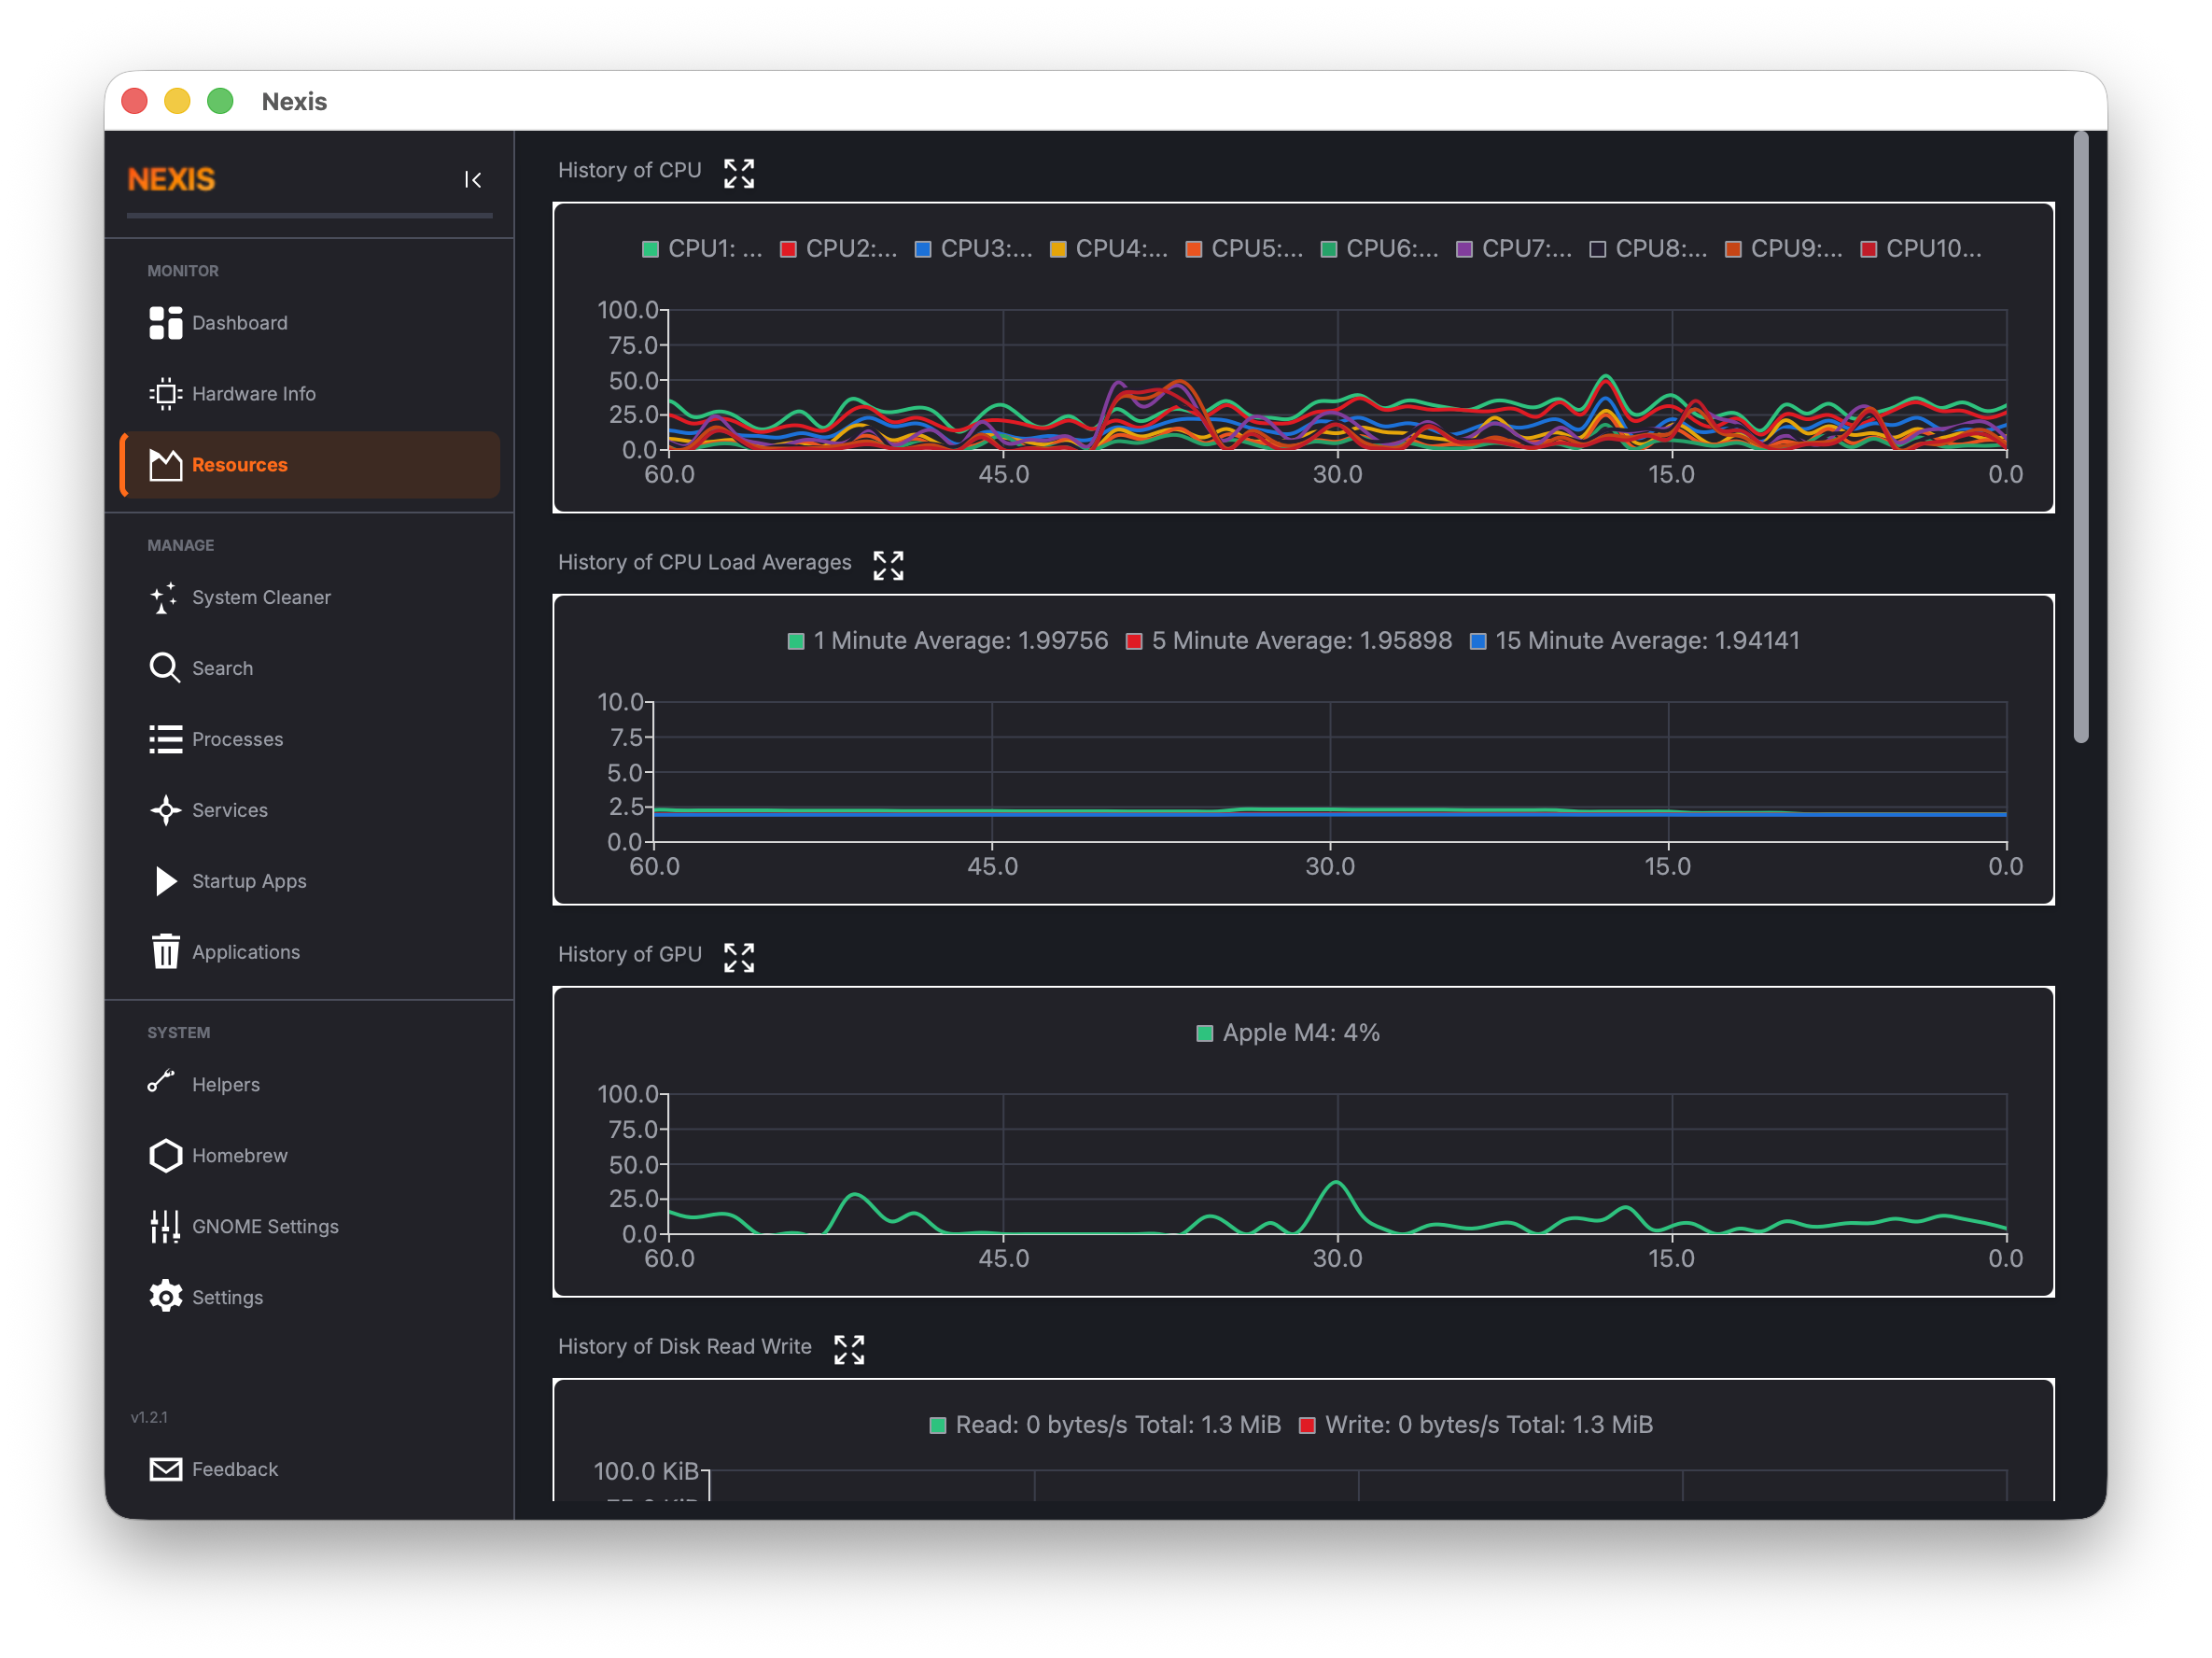
Live Mode
Live mode is the default view. It replaces what used to be thirteen separately-scrolled cards with six fixed-order subsystem cards — CPU, Load & Pressure, Memory, GPU (when present), Disk I/O, and Network — each about a third the height of the old cards. The grid shows 2 columns on a wide window and collapses to 1 column below roughly 1100px.
Every card follows the same design:
- 60-second sliding window — the chart always shows the most recent minute of data, scrolling continuously from right to left.
- 1-second refresh — data points are sampled once per second (with one exception noted below).
- Dynamic Y-axis — the vertical scale grows to fit a spike, then shrinks back down once that spike’s point ages out of the 60-second window, rather than staying latched at its highest-ever value.
- Current-value header — each card leads with a large current reading (and sometimes a smaller secondary line) instead of a text legend, the same style as the Dashboard’s tiles. The legend below the chart only names each line; it doesn’t repeat the live numbers.
CPU
A single “Total” line shows overall CPU utilization. Click Per-core in the card header to swap the chart for a live per-core list (utilization and clock speed for every logical core) instead of per-core lines crowding one chart.
Linux: If your CPU exposes Intel RAPL package-power data, the header’s secondary line shows current draw (e.g. “
12.4 W”). This is read-only telemetry — it doesn’t change what the card tracks.
Load & Pressure
Three lines show the classic Unix load average over one-minute, five-minute, and fifteen-minute windows, plus a dashed reference line at your core count — the same reference point uptime/top compare against, so a load number above the dashed line means the system is oversubscribed regardless of how many cores you have.
Linux: On kernels that expose
/proc/pressure/*(4.20+), three additional lines — PSI CPU, PSI Memory, PSI IO — plot each resource’s 10-second pressure-stall average on a secondary 0–100% axis. A missing pressure file just omits that one line; the chart itself isn’t Linux-only in principle, these extra lines are. Pressure stall measures time spent waiting for a resource, which (unlike load average) stays comparable across machines with different core counts.
Memory
Three lines: Swap, Memory (used), and one platform-specific series — Compressed on macOS, Cached on Linux. The header shows current memory usage as a percentage; hover it for a tooltip with the fourth figure that used to get its own line (Wired on macOS, Active on Linux).
Linux: When systemd-oomd or a cgroup v2 memory-pressure signal is available, a status line below the header shows OOM-kill activity (e.g. “
systemd-oomd active · 2 kills”) and expands into a list of recent kills when there are any. It’s hidden entirely on a host with no oomd/cgroup v2 signal.
GPU
Only present if one or more GPUs are detected. One line per device; the header shows the average utilization across visible GPUs.
Linux: GPU data comes from sysfs for AMD and Intel GPUs, or from
nvidia-smifor NVIDIA cards. If you have an NVIDIA GPU and this chart shows 0%, make surenvidia-smiis installed and working.
macOS: GPU data is read through IOKit and Metal APIs.
Disk I/O
Read and Write throughput in bytes per second. The header’s hero number is the current read rate; the secondary line combines the write rate with the temperature of a representative drive (e.g. “Write 2.1 MiB/s · nvme0 41°C”) when SMART temperature reporting is available — there’s no separate 30-second disk-temperature chart anymore, since a 60-second chart only ever had a couple of real samples at that poll interval.
Tip: If no temperature ever appears in the secondary line, your drives may not support SMART temperature reporting, or
smartctlmay not be installed. See the Troubleshooting page for more details.
Network
Download and Upload throughput in bytes per second. The header’s hero number is the current download rate, the secondary line the upload rate. Neither is ever labelled “Total” on this card — that word is reserved for the cumulative bytes-since-boot figure on the separate Network Usage page.
History Mode
Click History to switch to a persisted, cross-session log of CPU%, 1/5/15-minute load averages, and memory/swap — unlike every chart in Live mode, this one keeps sampling every 10 seconds even while Nexis is minimized to the tray.
History is opt-in and off by default. Turn it on with Record resource history in Settings, where you also choose how long to keep data (1 day, 7 days, or 30 days) and can Clear History at any time. Until it’s enabled, the History view shows a one-line explanation with a shortcut back to Settings instead of an empty chart.
Once enabled, a range selector offers Last Hour, Last 24 Hours, Last 7 Days, and Last 30 Days — only the ranges your configured retention can actually fill are shown, so you won’t pick a range that’s guaranteed to come back empty. Two charts plot the selected range on a real timeline (not the 60-second window Live mode uses): CPU & Load (CPU average/max and 1-minute load) and Memory & Swap (memory used and swap used). If a range genuinely has no data yet, it says so (“No history recorded for this period yet.”) rather than showing a blank chart. An Export CSV… button saves the raw rows for the selected range.
Disk Usage Launcher
Below the grid (in Live mode) sits a full-width card with two separate buttons: Launch your preferred external disk analyzer, or Built-in Treemap to jump straight into Nexis’s own Disk Map page — no separate application required, and the same page reachable from the sidebar’s CLEAN section, the tray quick menu, or the Command Palette. Clicking elsewhere on the card does nothing; only the two buttons are interactive.
The list of available external analyzers depends on your platform:
Linux: Baobab (GNOME Disk Usage Analyzer), Filelight, QDirStat, or ncdu.
macOS: GrandPerspective, DaisyDisk, or OmniDiskSweeper.
You can also specify a custom path to any disk analyzer application you prefer. Configure this in the Settings page.
What’s Next
See how the built-in visualizer works on the Disk Map page, or learn about the Hosts File Manager and other utility tools on the Helpers page.