Network Usage
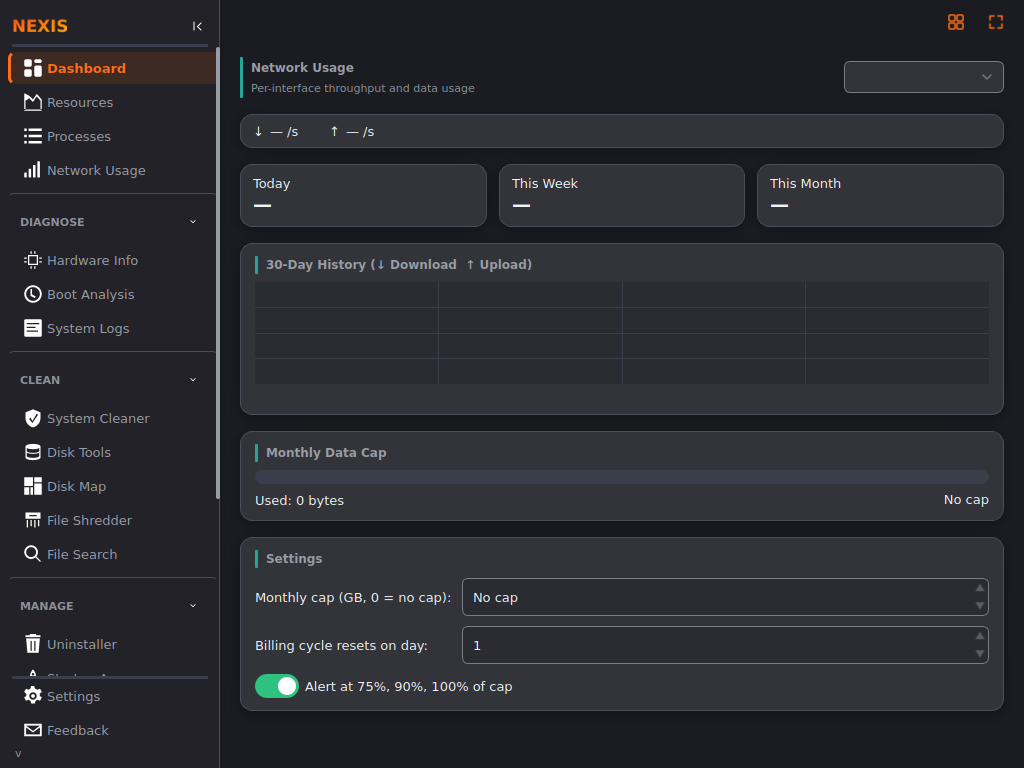
The Network Usage page tracks how much data each of your network interfaces has used, and lets you set a monthly cap with alerts as you approach it. Unlike the live throughput chart on the Resources page, this page accumulates totals over days and months.
Always-On Tracking
Nexis tracks network usage continuously in the background, starting as soon as the app launches — you don’t need to have the Network Usage page open for data to be recorded. Every active interface (Wi-Fi, Ethernet, or otherwise) is tracked, not just your current default connection, so switching between Wi-Fi and a wired connection doesn’t lose history.
Interface Selector
Use the selector at the top of the page to view All Interfaces combined, or focus on a single adapter.
Live Rate
A live readout shows current download (↓) and upload (↑) throughput in real time.
Usage Summaries
Three summary cards show totals for:
- Today
- This Week
- This Month
30-Day History
A stacked bar chart shows download and upload data per day over the last 30 days, so you can spot which days had unusually heavy usage.
Monthly Data Cap
If your internet plan has a data cap, configure it here:
- Enter your cap in GB.
- Set your billing cycle reset day (the day of the month your usage resets, 1-28).
- Optionally enable alerts.
The progress bar changes color as you approach your cap — green under 75%, amber between 75% and 90%, and red above 90%. Setting the cap to 0 disables the cap feature; the tracking itself is unaffected.
Tip: With alerts enabled, Nexis sends a system tray notification once each time you cross 75%, 90%, and 100% of your cap within the current billing period — you won’t be notified repeatedly for the same tier.
What’s Next
See live, second-by-second network throughput alongside your other system resources on the Resources page.